Secrets of ThinkOrSwim: how to set up indicators, premarket scanners, watchlists 🔥

📈 Chart Settings on the ThinkOrSwim trading platform
To set up charts in the ThinkOrSwim trading platform, go to the “Charts” chart section. On the left side of the screen you will see information about your account, watchlists and quick charts of SPY. On the right side of the screen are various applications for trading (“Trade”, “Times and Sales”, “Level II”, “Live News”), etc.
▪️ Let’s set up the graphics in TOS. To set up the chart, we need to go to the “Chart settings” settings (the gear icon ⚙️ in the upper right corner) and click on the icon. Next, select “Appearance”. Here you can configure the colour scheme 🌈 of the graphs, as well as the type of display. In the “Common” section, I usually remove the grid on the chart 📈 by unchecking the “Grid”, applying the settings with the “Apply” button.
▪️ For the background, I usually set a contrasting black colour ◾️ for convenience (in the “Background” section). You can also configure the type of chart display for yourself (bars, candles, lines and others). Many traders prefer to use the “Bar Charts”, but I use the “Candle Trend Chart”.
▪️ The “Equities” tab allows you to disable the display of premarket and postmarket, as well as remove the display of volumes only on stocks. If you want to make these settings on futures as well, go to the futures tab. So, we pass to the section of shares “Equities” and uncheck the box next to the volume “Show volume subgraph”, apply — “Apply”. After applying the settings, we will see that the blue volume scale at the bottom of the graph has disappeared. For large volumes, you can return this setting back.
▪️ In the same section, I always leave on the option to show the extended trading session (show Extended-Hours Trading session), because I often trade intraday, so I need to see a premarket and monitor the levels. I also leave on displaying corporate events on the chart (show corporate actions) 📊 so that all historical and future corporate events are visible. Please note that future corporate events require additional settings in the “Time axis” tab.
▪️ Go to the tab “Favorite time frames”. Here we set up the trading period (timeframe). I usually use the following settings in the daily: daily time frame — 5 years, aggregation period — day; in the intraday: the time interval is 10 years, the aggregation period is 3 minutes (you can also set it to 5 minutes and 10 minutes). Apply the settings by clicking “Add”. Timeframes can be dragged as you wish, according to your preference. When you have added and configured your timeframes, click on “Apply” and “Ok”.

🔥 How to set up indicators in Thinkorswim
In the “Studies” section, indicators are set that are superimposed on the chart and strategies are tested. The Thinkorswim program already has a huge number of indicators. We can use the built-in search and quickly find the right one, knowing its name.
▪️ Go to the “Studies” tab, then select “Edit Studies”. Now you can add indicators that you prefer to use. For daily charts, I usually use the Simple Moving Average (SMA) indicator.
▪ ️To select an indicator, start entering its name in the search bar and select “Add selected”. The indicator is placed on the right side of the window, where we can configure its parameters. Each indicator has its own settings.
▪️ In the “Price” section, click on the gear for further settings. The length of the inputs (inputs length) — 200 days; in “SMA” select the display colour of the indicator on the chart and apply the settings. Now you can observe that a 200-day moving line appeared on our chart.
💡 The indicator display can be moved to the area where volumes are displayed or to an additional area below, which will be located under the volumes. You can remove the indicator from the chart by clicking the cross next to its name.
Together with the indicator “Moving Average SMA” I also use the indicator “Volume average price” (50). Now you can see the volumes on the chart. Many people like to use the “RSI” indicator for daily charts.
💡So, we have set up the necessary parameters for daily charts. If you want to increase an individual part of the chart in a certain month, hold down the left mouse button on the chart, move from left to right and release in the right place, thus you will increase a certain part of the timeframe.
✅ You can save all the settings — for this, go to “Studies”, “Load study set”, then “Save Study Set” and name the file, for example: “Daily setup”.
In addition to the existing indicators, you can add your own, select the indicator you like on our blog or order the development of an indicator for your needs from us. It is very easy to add a ready-made indicator in TOS: in “Studies”, click the “Create” button, enter the indicator name and paste the ready-made ThinkScript script. After the indicator is created, it will appear in the list of your indicators and will be ready for use.

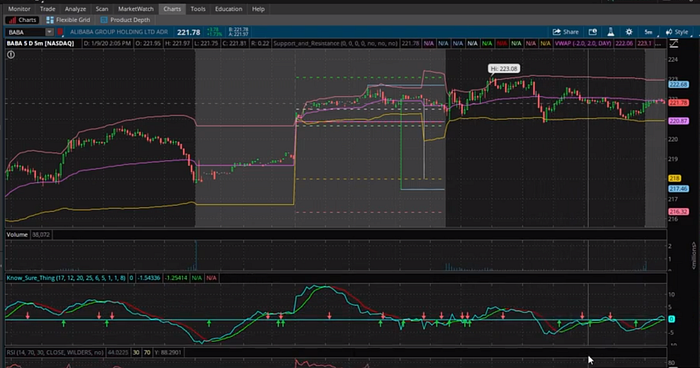
📈 How to set up intraday graphical indicators in the TOS platform
To configure, go to “Studies”, “Edit Studies”. I prefer to use the VWAP indicator. To add an indicator for TOS, we begin to enter its name, select “Add selected” and “Apply”. Now you can observe the VWAP lines on the chart.📉
⚙️ Click on the gear icon for indicator settings. In the sections “UpperBand” and “LowerBand”, uncheck the boxes next to “Show piot”, “Show bubble”, “Show title”. Select the colour of the VWAP line and apply all the settings — “Ok”, “Apply”. Now you can see on the chart just one VWAP line, which I use for intraday trading.
❗️ You can also add a relative strength index (RSI) indicator in TOS, which shows the strength of the trend and the likelihood of it changing. I know that this indicator is very popular among intraday traders. I usually don’t use it.
A useful indicator for TOS is “Previous Day Close”.💡 We save all our parameters for intraday trading. To do this, go to the “Studies”, “Save study set” tab and come up with a name for these parameters (for example: intraday). After saving, we can load any of the saved stage sets by clicking on the “Load study set” in the “Studies” tab.
So, now we have set up the parameters for intraday and daily charts in Thinkorswim with basic indicators.
📊 How to configure Flexible grid for charts in Thinkorswim trading platform
Let’s move on to setting up the Flexible Grid for TOS charts.
In the Flexible Grid tab, located on the right side of the Charts tab, you can configure a more flexible grid for your charts (not according to the proposed template, as it is implemented in the “Charts” tab, but created by you).
In the upper right corner (under the OnDemand shortcut), click on the icon and put a checkmark next to “Customize grid” to activate the grid editing mode. Flexible Grid functionality in TOS allows you to add and remove windows for charts. They can be customized as you want and in the quantity you need.
💡 To hide the unnecessary gray panel to the right of the charts, uncheck the “Side bar” box — this can only be done in the grid editing mode. As soon as you exit the grid editing mode, unchecking the “Customize grid” will turn off this option for customization.
So, after you have activated the “Side bar”, windows for charts will open in front of you. Add a grid by clicking on the “+” in the middle. Press “+” a few more times to display 6 separate windows for charts (see the screen below).
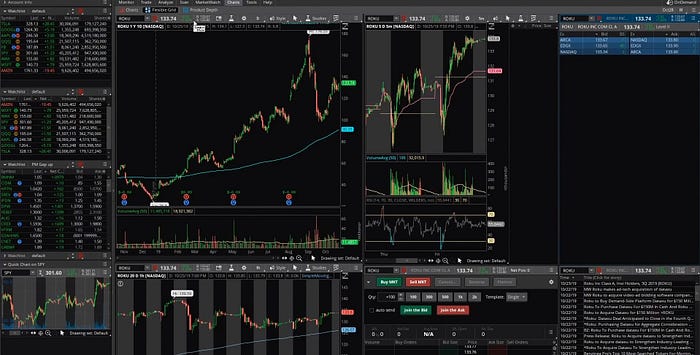
- Set up the first window using the TESLA (TLSA) example. Set link color red for the first and second chart window. We see that they are the same. Go to the “D” settings in the second chart window and select the 5-minute timeframe for intraday trading (5m 5D: 5m). Click on the bulb icon in the same window, select “Load study set” and click on the previously saved parameters for intraday. Now we have 2 chart windows with different timeframes.
- Go to the third window and remove the schedule. To do this, click on “C” in the right side of the window in the gray panel. Instead of the charts, activate “Level 2” for TESLA, also located on the right side of the window. For the second window, activate “Timing Sells” (TS).
- For the next window, I usually use a different chart. Link is also red, and I select the timeframe (1h 20 D: 1h).
- For the fifth and sixth windows, I also choose link red. In the fifth window, turn off the chart by clicking on “C” and use the “Active Trader” (AT). Set the buttons, — for this, click on the gear icon in the same window and in addition to the already installed ones, add “Buy Bid”, “Sell Ask” and “Quantity with Buttons”, then — Ok. To expand all the options, next to “Buy MKT” click on the arrow.
- In the last window, I prefer to post news, so we also turn off schedule “C” and select “N” (news for TESLA). Done.
💡 If you change the link for the ticker, for example, in the first window, change TLSA to ROKU, all windows will also be updated. Now you can expand the necessary windows and narrow down the less important ones, as well as remove the unnecessary gray panel to the right of the charts by unchecking the “Side bar”.
Go back to the grid settings in the upper right corner (under the OnDemand shortcut) and uncheck the “Customize grid” box.
You can also save this grid by clicking on “Save flexible grid as” and name the grid today’s date, for example (July20) and “Save”. For convenience, you can also disconnect the window with all charts 📈 and move to any part of the screen by clicking on the tab (under the OnDemand shortcut) on “Detach”.
As a result, you get different screens with flexible grids, which is very useful and convenient.
📈 How to set up premarket scanner in TOS trading platform
⚙️ Let’s move on to setting up a premarket scanner in the Thinkorswim platform. Go to the “Scan” tab. In the upper right corner, click on the list icon “Show scan query menu” — “Load scan query”, select “Personal”. Here we have a list of scanners that we use in TOS. The scanners I often use are the Low Float Scanner and the Pre-Market Gap up Scanner.
In the “Public” section you will find existing scanners with various percentages of “Change Gainers”, “Change Losers”, etc.
Set up Low Float Scanner in the TOS trading platform. Go to the “Stock” settings (“Scan” tab). Click on “Mark”, stock price min .: 1.00, max .: 20.00. Volumes for a premarket scanner I put min .: 5,000. In “Stock” I select “Shares”, min .: 50,000, max: 10,000,000. After you have set all the parameters, click the “Scan” button. Done, the necessary results on the set parameters should be pulled down below.
💡 Save these parameters to Thinkorswim. To do this, select the list icon at the top right — “Save scan query” and name the TOS scanner, for example, “Premarket Low Float”.
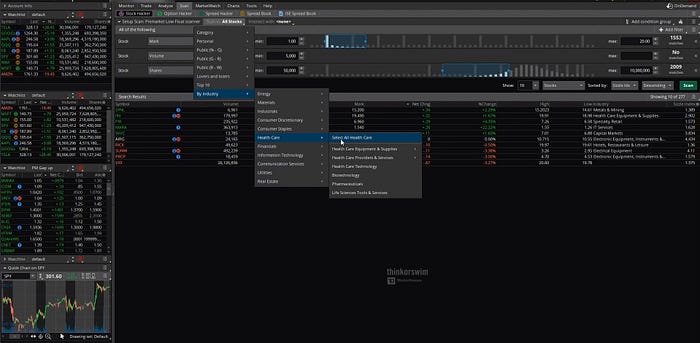
Set the parameters for the Gap up scanner in Thinkorswim. The minimum price will also be 1 dollar, but the maximum is increased to 100.00. We leave the volume the same as for Premarket Low Float — 5000. In the “Stock” column, apply “% change”. I usually put a minimum of 5%, click on the “Scan” button. Done, the premarket list has opened. We will also save the parameters in TOS by selecting “Save scan query”. We call the scanner “Premarket Gap up”.
When I scan the Low Float Pre-Market in CBT, sometimes I prefer to scan stocks by sector (Scan in All Stocks By industry): Health Care — Select All Health Care. For quick access, the stock scanner by sector in the TOS trading platform can also be saved using the method described above.
🔥 How to create and configure watchlists in Thinkorswim
In order to create a TOS watchlist that will scan stocks that match the specified criteria, go to the watchlists panel (on the left side), select “Create scan query”. We give a name to the future list, and indicate which shares to scan. By default, all shares on the market are scanned in TOS, but you can change the criteria for yourself.
You can only scan stocks that are in the Thinkorswim watchlist you created earlier. To do this, in the “Personal” section, select the desired watchlist. In the panel below, apply various filters: filters for stocks, for options, custom filter rates and fundamental filters.
The first filter deals with the selection of shares by the parameter “Net change” (change in price from the opening). The second by the parameter “Volume” (by the volume traded). Each of the filters has its own settings.
⚙️ Lets set them up so that the TOS scanner will show shares with a current trading volume of at least 100,000 and a price change of +50 cents from opening. The bottom filter, which offers the default sorting by changes in%, is not needed in my case, so choose another filter parameter from the pop-up list or delete it.
💡 If you need to add another filter, activate one of the 4 buttons at the top, responsible for adding the filter of the desired type. You can select a custom filter and from the drop-down list select, for example, Average Volume (by average daily volume). It is also possible to specify Custom at the bottom and insert your own script for the scanner. In “Aggregation” select the timeframe by which the calculations will be made.
In the tab “ThinkScript Editor” your code is written or ready-made code is inserted. If you want to write your ThinkScript code for the TOS trading platform, you can order its development from us by contacting us below.

The source of this article is our website. The blog has a large selection of articles on Thinkorswim settings, scripts, indicators, scanners, etc.
🔥 If you have problems registering a Thinkorswim live account (TOS) without delaying quotes, write to us via the contacts from the profile and we will help.